Check what your team delivered
Before a weekly review or a status report, you want to know what actually got done: how many tasks finished, whether work is piling up faster than it closes, where each large piece of work stands, and how much shipped as merged pull requests. The command center's Delivery tab shows all of it for any period.
Who can do this: requires the org owner or org admin role. Members don't see the command center or Reports in the sidebar.
-
In the sidebar, select Reports. The command center opens.
-
In the bar, pick the range to report on, such as 7d for a weekly review or 30d for a monthly one. To report on one project only, pick it in Project. Every figure on the page follows both.
-
Select the Delivery tab.
-
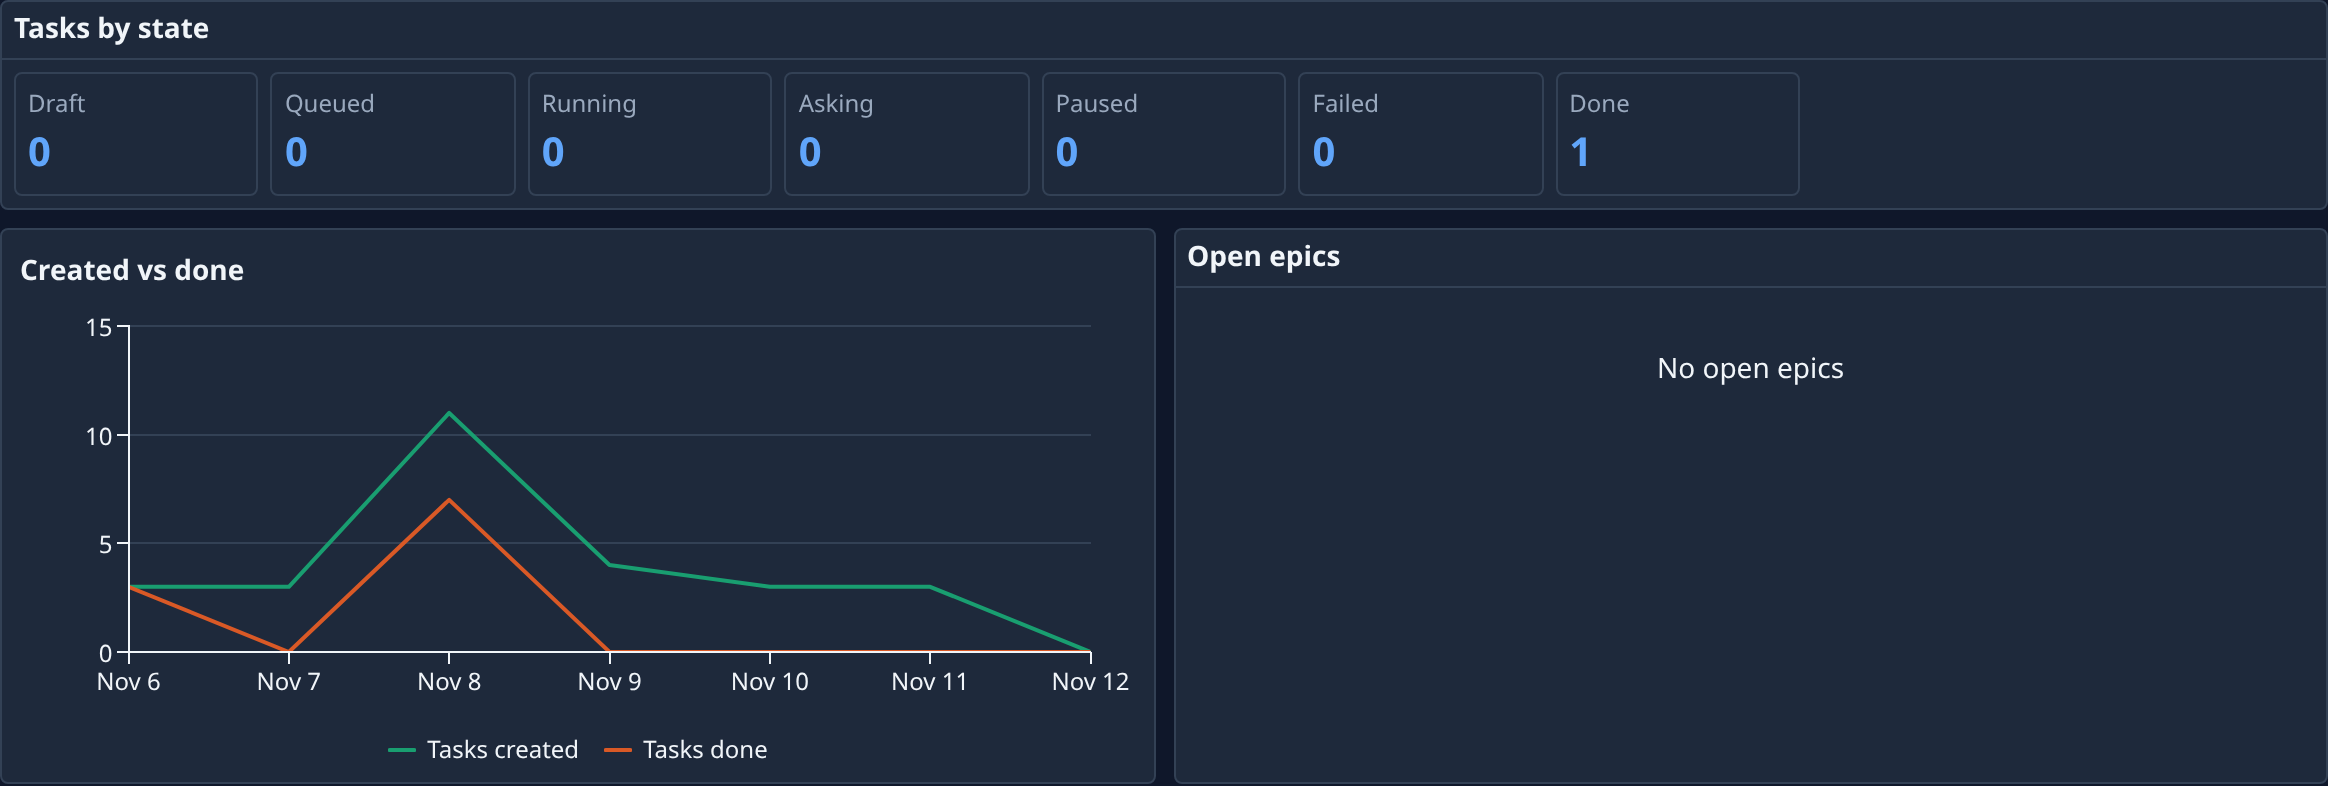
Read Tasks by state: how many tasks are in each state now. Select a count to open the task board filtered to those tasks, for example to list the failed ones.
-
Read Created vs done over the range. When the created line keeps running above the done line, work is arriving faster than it finishes.
-
Read Open epics: each large piece of work still open, with its project and the stage it has reached, such as Design, Plan or Coder. The chips above the list count the epics at each stage. Select an epic's name to open it.
-
Scroll down for what shipped: pull requests merged and tasks closed without one, lines changed, tasks done by agent, artifacts by kind, the epic funnel and how long epics take from start to finish. Where a chart has a grouping menu, pick By project, By agent, By model or By person to split it another way.
-
To report on quality next to output, select the Quality tab: tasks done, success rate and median cycle time, each against the range before.
The tab, range and project are kept in the page's address: bookmark the view or send its link to another admin.
Related
- Read the command center — every tab, tile and health state.
- Find what needs attention — the failed, stuck or at-risk work behind the numbers.
- How epics and features work — the stages an epic moves through.