How the command center works
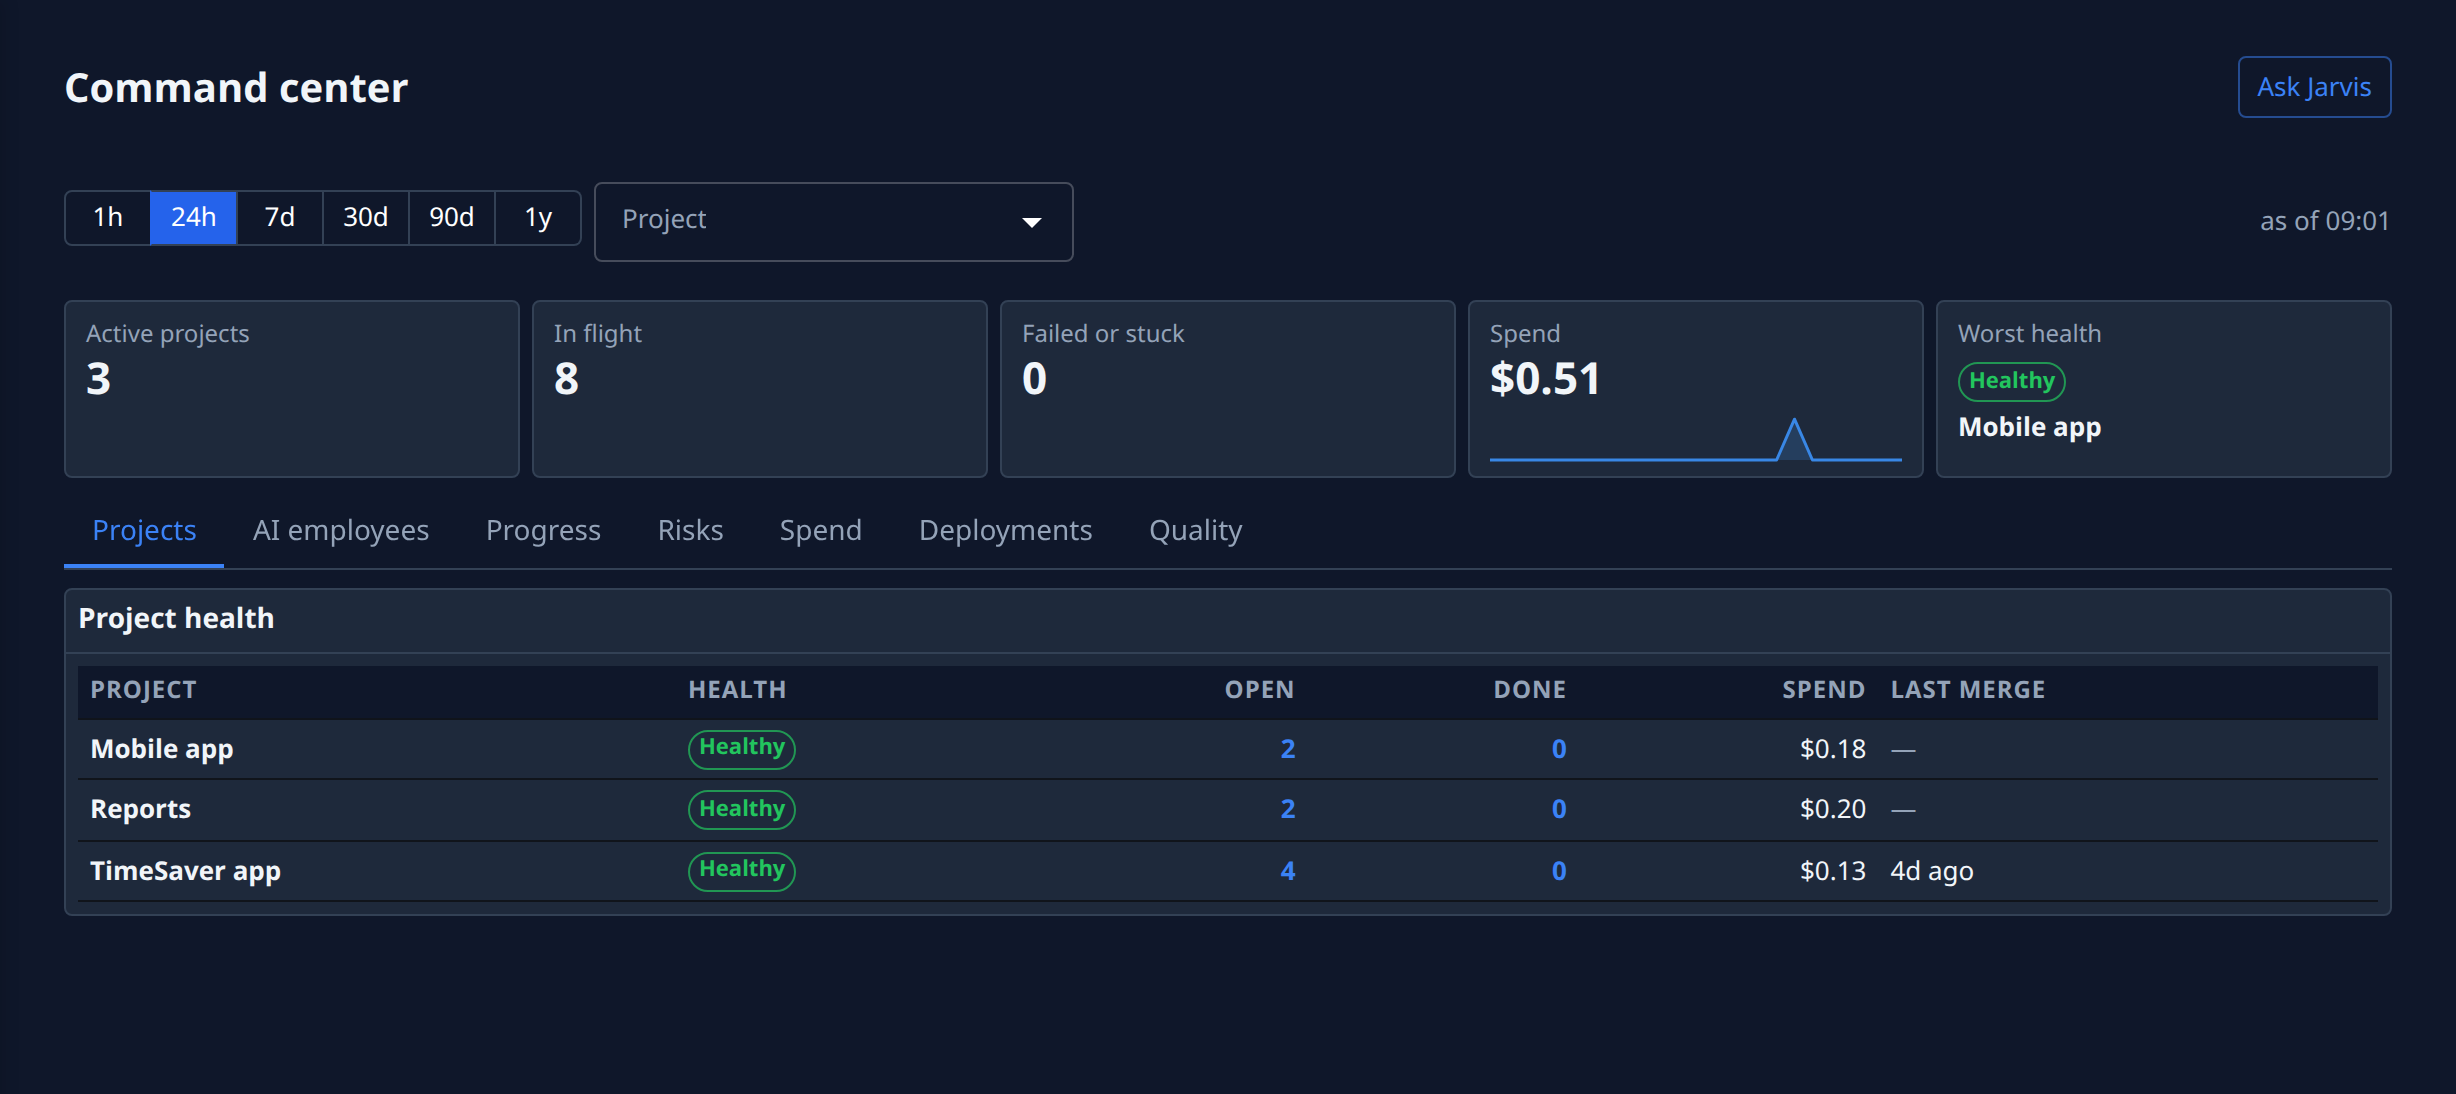
The command center is one page that answers a single question for an organization's Owners and Admins: what is happening with the company today? They open it from the Reports row in the sidebar, below Directory. Members never see it.
Where its figures come from
The command center keeps no data of its own. Every figure is read from work already in Jaah, for your own organization only:
- Tasks give the counts: what is in flight, done, failed or stuck. Each count opens the Tasks board filtered to the tasks behind it, so any number can be checked against the work itself.
- Projects give the rows of Project health and Releases. A project's name opens the project; see How projects work.
- Members of your projects are the rows of People: a member is anyone with a role on the project, directly or through a group, plus anyone who created a task in the range.
- Personas are the Agents: each persona with work in the range, how much it finished and what it cost. See How personas and playbooks work.
- Epics show on Delivery with the stage each has reached. See How epics and features work.
- Releases read each project's latest CI run from its Git host as you look, through your own Git connection. When it can't be read, the page says Unknown and why.
The range (1h to 1y) and the Project picker narrow every figure at once, and the page's address
keeps them, so a copied link opens the same view. as of says when the figures were taken; the page
refreshes on its own every few minutes. A figure with no data shows —, never a zero.
Delivery, Cost, the AI review on Quality and the anomalies and weekly digest on Risks use the same formulas as the Operator dashboard, counted over your organization only.
Health
Every project is in one of three states, worked out afresh each time the page refreshes:
| State | Meaning |
|---|---|
| Healthy | Every factor is fine. |
| Watch | At least one factor needs a look, and none is bad. |
| At risk | At least one factor is bad. |
A project's state is the worst of its factors: failed tasks, tasks waiting too long, merge failures, spend against its usual level, days since a task moved, and the latest CI run. A project with nothing to judge shows No data, never green. Worst health in the overview names the project in the worst state. As the factors change — a failed task is restarted, CI turns green — the state follows on the next refresh; nothing has to be cleared by hand.
Asking Jarvis
Ask Jarvis, at the top right, opens the Help assistant on a new chat with the question already written: "What's happening with my company today?". Jarvis answers from the same figures the page shows, and can open a view of chosen tiles for one or more projects as a link in the chat. That view stays open while its chat is your latest one and has been active in the last day; after that it expires. See Find your way around.
Related
- Read the command center — every tile, tab and column on the page.
- How tasks work — the states behind the counts.