Find what needs attention
The command center shows, on one page, which work across your organization has failed, is stuck or is costing more than usual. Use it to go from a number to the tasks behind it in a few clicks.
You need the org owner or org admin role. Members don't see the command center or Reports in the sidebar.
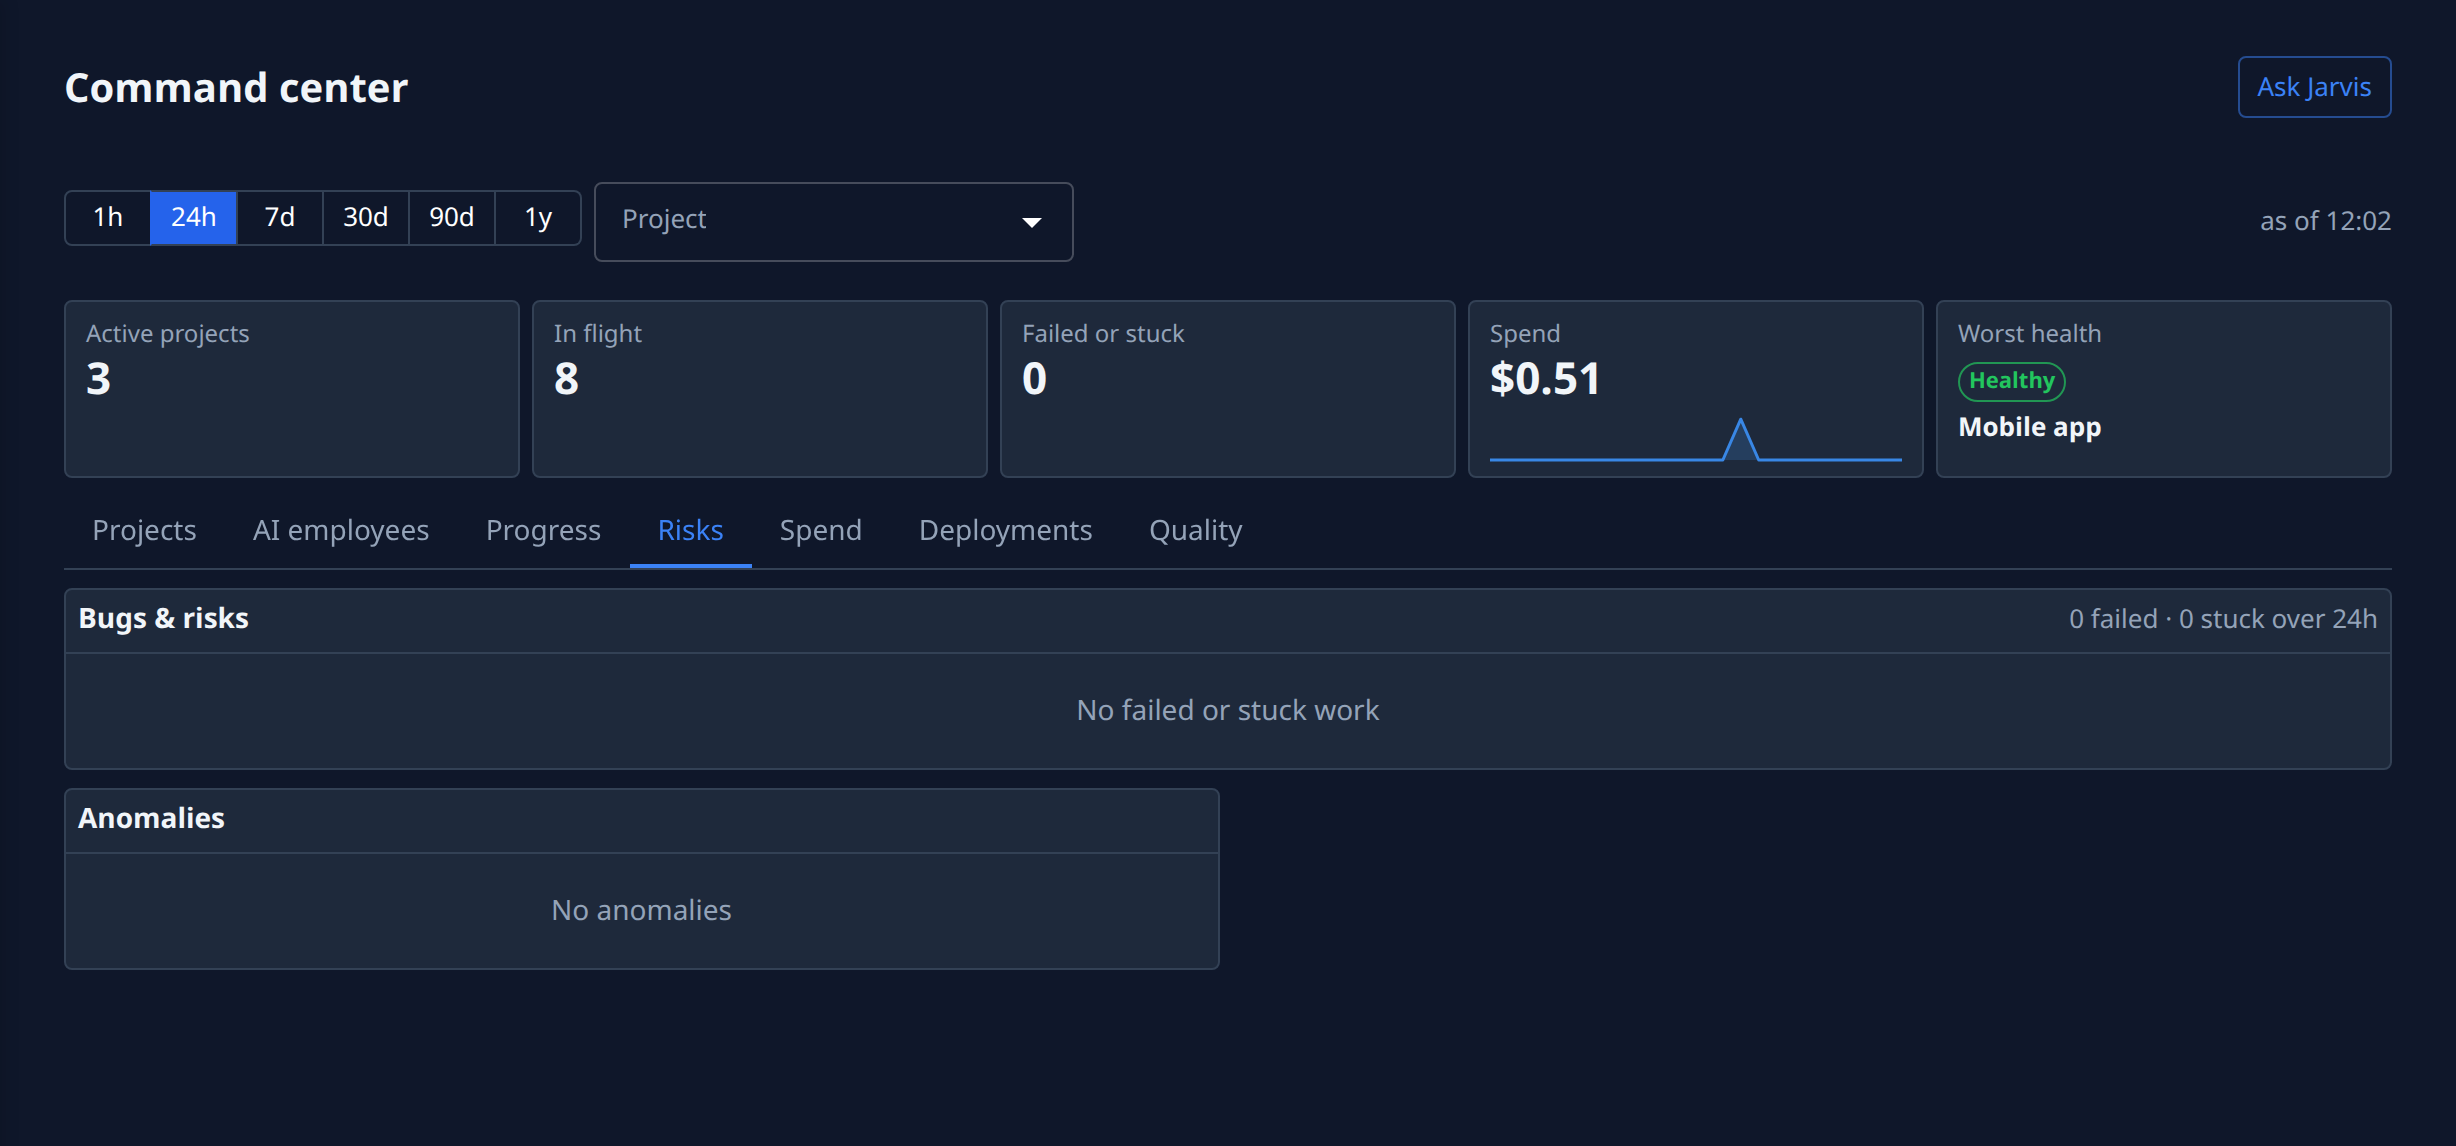
- In the sidebar, select Reports, below Directory.
- In the bar, pick the range to look back over: 1h, 24h, 7d, 30d, 90d or 1y. To look at one project only, pick it in Project.
- Read the overview tiles. Failed or stuck counts the work that needs a person, and Worst health names the project in the worst state. Hover a tile to read what it counts.
- Select the Risks tab. Bugs & risks lists each failed, stuck or merge-failed task, with its Project and how long ago it started (Since); the reason is on the row's hover. When there is none, it reads No failed or stuck work.
- Select a task's name to open it, then restart it, answer its question or stop it. See Stop, restart or reset a task and Answer a question.
- Check Anomalies below: each metric off its usual level, such as cost, tasks created or failure rate, with the value against it. Weekly digest sums up what changed last week.
- To see why a project is not Healthy, select the Projects tab and hover or tap its health chip: it names every factor and its colour in words. Select the project's name to open it.
The page refreshes every few minutes, and a project's health follows on its own once the work behind it recovers. Nothing has to be cleared by hand.
Related
- How the command center works — where the figures come from and how health is decided.
- Read the command center — every tile, tab and column on the page.
- How tasks work — the task states behind each count.