Command center
The command center answers one question for your organization's Owners and Admins: what is happening
with the company today? Owners and Admins open it from the Reports row in the sidebar, below
Directory, at its own address, /reports. Everyone lands on the Tasks board when they open Jaah.
It shows only your own organization's data, and it is on for every plan, trials included.
The bar and the overview
- Range:
1h,24h(the default),7d,30d,90dor1y. Every figure on the page covers it. - Project: narrows the whole page to one project.
- as of: when the figures were taken. The page refreshes every five minutes.
- Ask Jarvis: at the top right, opens a chat with Jarvis about the company today. Greyed, with the reason on hover, while Jarvis is off or can't be reached.

Under the bar, five tiles: Active projects (projects with open tasks, or a task that moved in the range), In flight (tasks queued, running or asking now), Failed or stuck, Spend in the range, and Worst health, the project in the worst state, which opens that project. Hover any tile to read what it counts.
A figure with no data shows — with the reason under it, such as no finished runs in range. It never shows as 0 or $0.00. An organization with no project yet sees No projects yet instead, with one button: New project, or Add project when you have a connected Git account.
The tabs

| Tab | What it shows |
|---|---|
| Projects | Project health: every project, active ones first and inactive ones marked. Each row has its last merge, spend, open tasks, tasks done in the range and health. The name opens the project; each count opens the Tasks board filtered to it. Under it, Releases: each project's latest CI run on its main branch and its last merges. CI that cannot be read (no repository, no forge connection, a forge error) shows Unknown with the reason. |
| People | Each member of your projects and anyone who created a task in the range: tasks created, their change against the period before, tasks per day, done, success rate, PRs merged, net lines, tokens, cost, cost per done task, hands-off rate, median answer time and last active. Members with no activity are listed too. Switch to Project to see one row per project. Above the table: members, active people, hands-off rate, human minutes per merged PR and median answer time. |
| Agents | Each agent with work in the range, work in flight now, or spend in the range: success rate, spend, in flight and done. An agent that ran only inside epics gets a row for its spend; its success rate shows —, and hovering it reads ran only inside epics. Epic spends nothing itself, since an epic never runs: its Spend shows —, and hovering it reads epics never run; their agents spend. The name opens the Tasks board filtered to that agent. With agent performance on your plan, it also shows Performance and Best setup: each agent whose best-ranked setup isn't the one it runs now, both side by side by success and cost per success, with Change default. With intelligent routing on your plan, it also shows the router's results against the default. |
| Delivery | Tasks by state now, each count opening the Tasks board on that state; Created vs done; Open epics with their stage (Analyze, Design, Plan, Coder, Merged) and a count per stage. Then PRs merged, tasks closed without a PR, lines changed, tasks done by agent, artifacts by kind, the epic funnel and cycle time. |
| Cost | AI spend in the range, the Spend trend chart across the panel's full width, and the split by project, agent and model. Usage on a model with no price shows as Unpriced with its token count. Then tokens, retries, failure rate, your own accounts' quota, cost per PR, per thousand lines and per epic, and the spend on failed work. |
| Quality | Tasks done, success rate, zero-touch rate, median cycle time, cost per merged PR and AI review score, each against the range before. Then the weekly AI review: score trend, the spread from 1 to 5 and the lowest-scored work with the reviewer's reason. With agent performance on your plan, it also shows four more tiles (Outcome success, First-pass merges, Defects per 100 merges, Cost per success), Compare and the Ranking of every setup. |
| Risks | Bugs & risks, headed by how many tasks failed and how many are stuck: failed tasks, tasks waiting on a person or paused too long, and merge failures, each with its reason and age. Anomalies: each metric off its usual level, with the value against it. Weekly digest: the AI's summary of what changed in the week it names. |
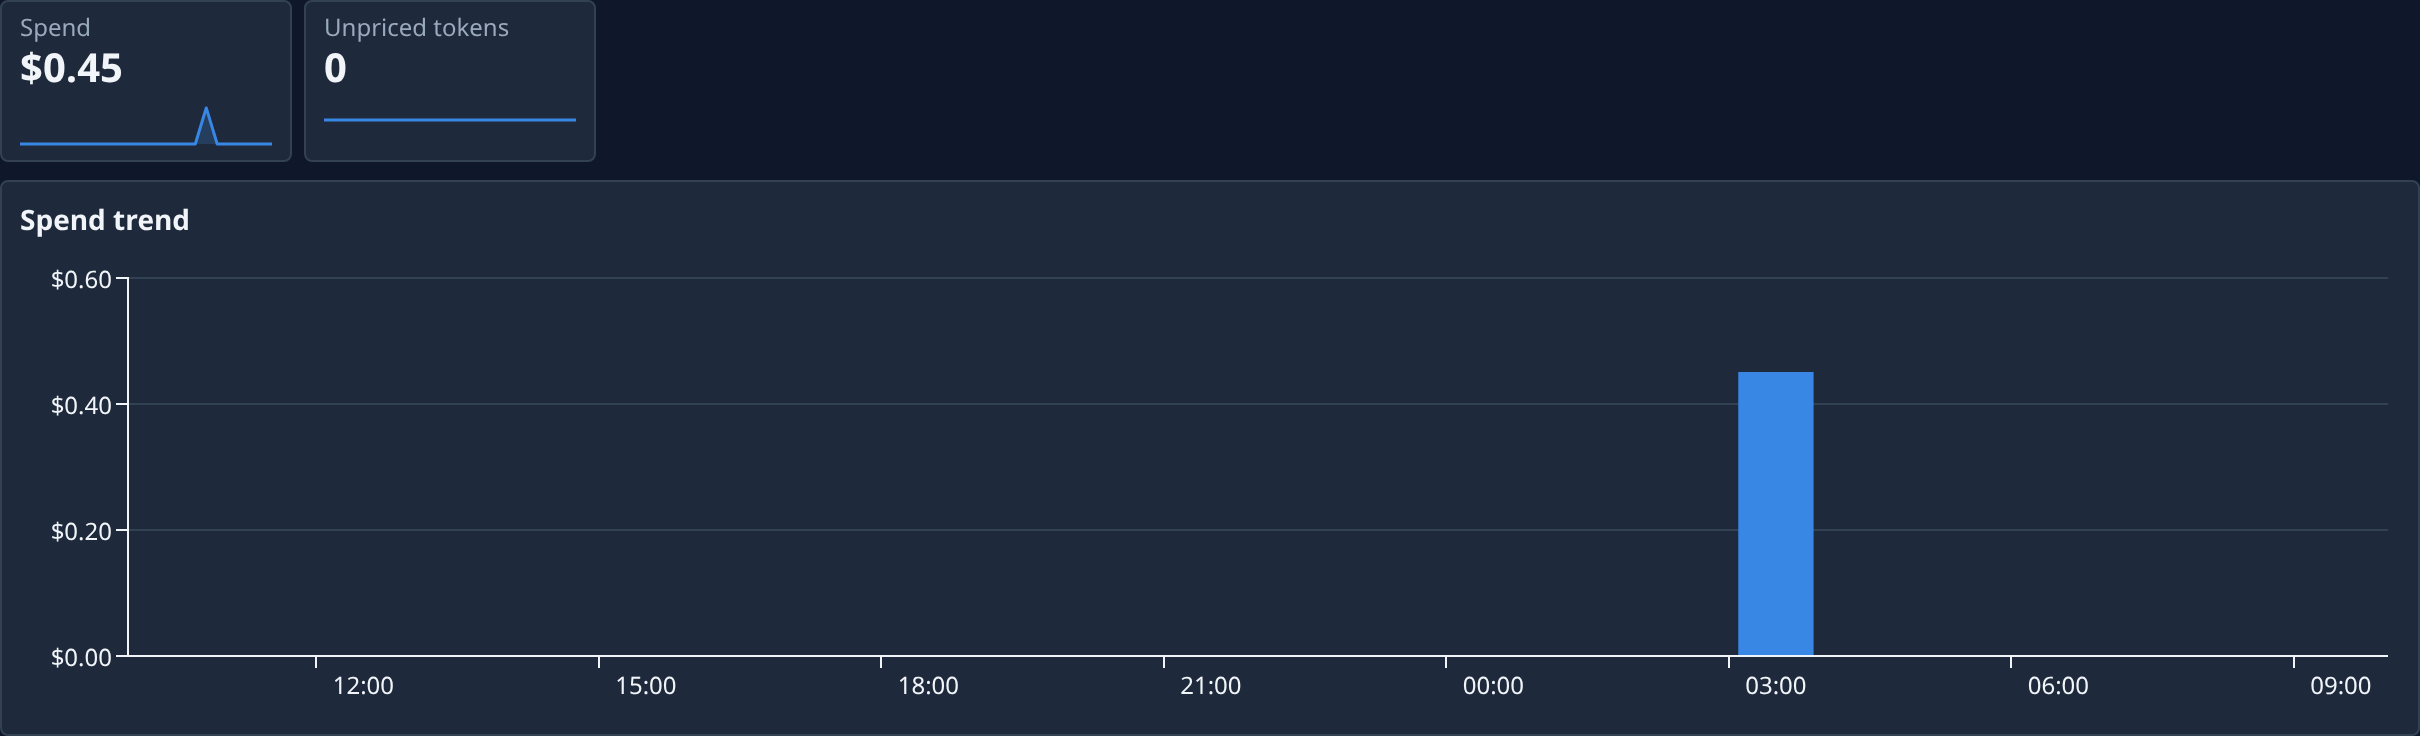
On Cost, a range with no finished runs shows No finished runs in range. in place of the charts.
Charts that split by a dimension have a menu to regroup them: By project, By agent, By model or By person. The choice is kept in the page's address.
Health
Each project is Healthy, Watch or At risk: the worst of its factors: failed tasks, tasks waiting too long, merge failures, daily spend against its usual level, days since a task moved, and the latest CI run. Hover or tap the chip to read every factor and its colour in words, such as "2 failed tasks — red". A project with no tasks and no repository shows No data, never green.
A Jarvis view
When Jarvis, the Help assistant, answers with figures from the command center, its answer can link a Jarvis view: a read-only page with just the widgets that answer named, such as Project health or Spend by model, for up to six widgets. Every figure equals the command center's for the same range and project.
- Jarvis view heads the page, with the range and the projects it covers under it, such as 24h · All projects. When the answer named more than one project, each project gets its own section, under its name.
- Reports, at the top right, opens the full command center.
- Widgets that need agent performance are left out when your plan doesn't include it.
- Nothing on it can be saved, pinned or edited.
The view lasts only as long as its Help chat. Once the chat has ended, the page shows Expired and This view lasted only for its chat., with Open Reports. A link that names no widget the command center has, a chat that doesn't exist, or only projects you can't see shows Page not found. Like the command center, it is for Owners and Admins; anyone else gets No access to that page.
Related
- How the command center works: where its figures come from and who sees it.
- Find what needs attention: the steps from a red tile to the task behind it.
- How projects work: the projects its health rows roll up.