Review anomalies and the weekly digest
Jaah watches your organization's daily figures and flags a day that moved well away from its usual level: the AI cost, the number of tasks created, the failure rate and the quota used on your own model accounts. Once a week it also writes a short summary of what changed. Both sit on the command center's Risks tab. A few minutes there each week tells you whether something needs a closer look.
Who can do this: requires the org owner or org admin role. Members don't see the command center or Reports in the sidebar.
-
In the sidebar, select Reports. The command center opens.
-
In the bar, pick the range to look back over, such as 7d or 30d. A longer range checks more days. To look at one project only, pick it in Project.
-
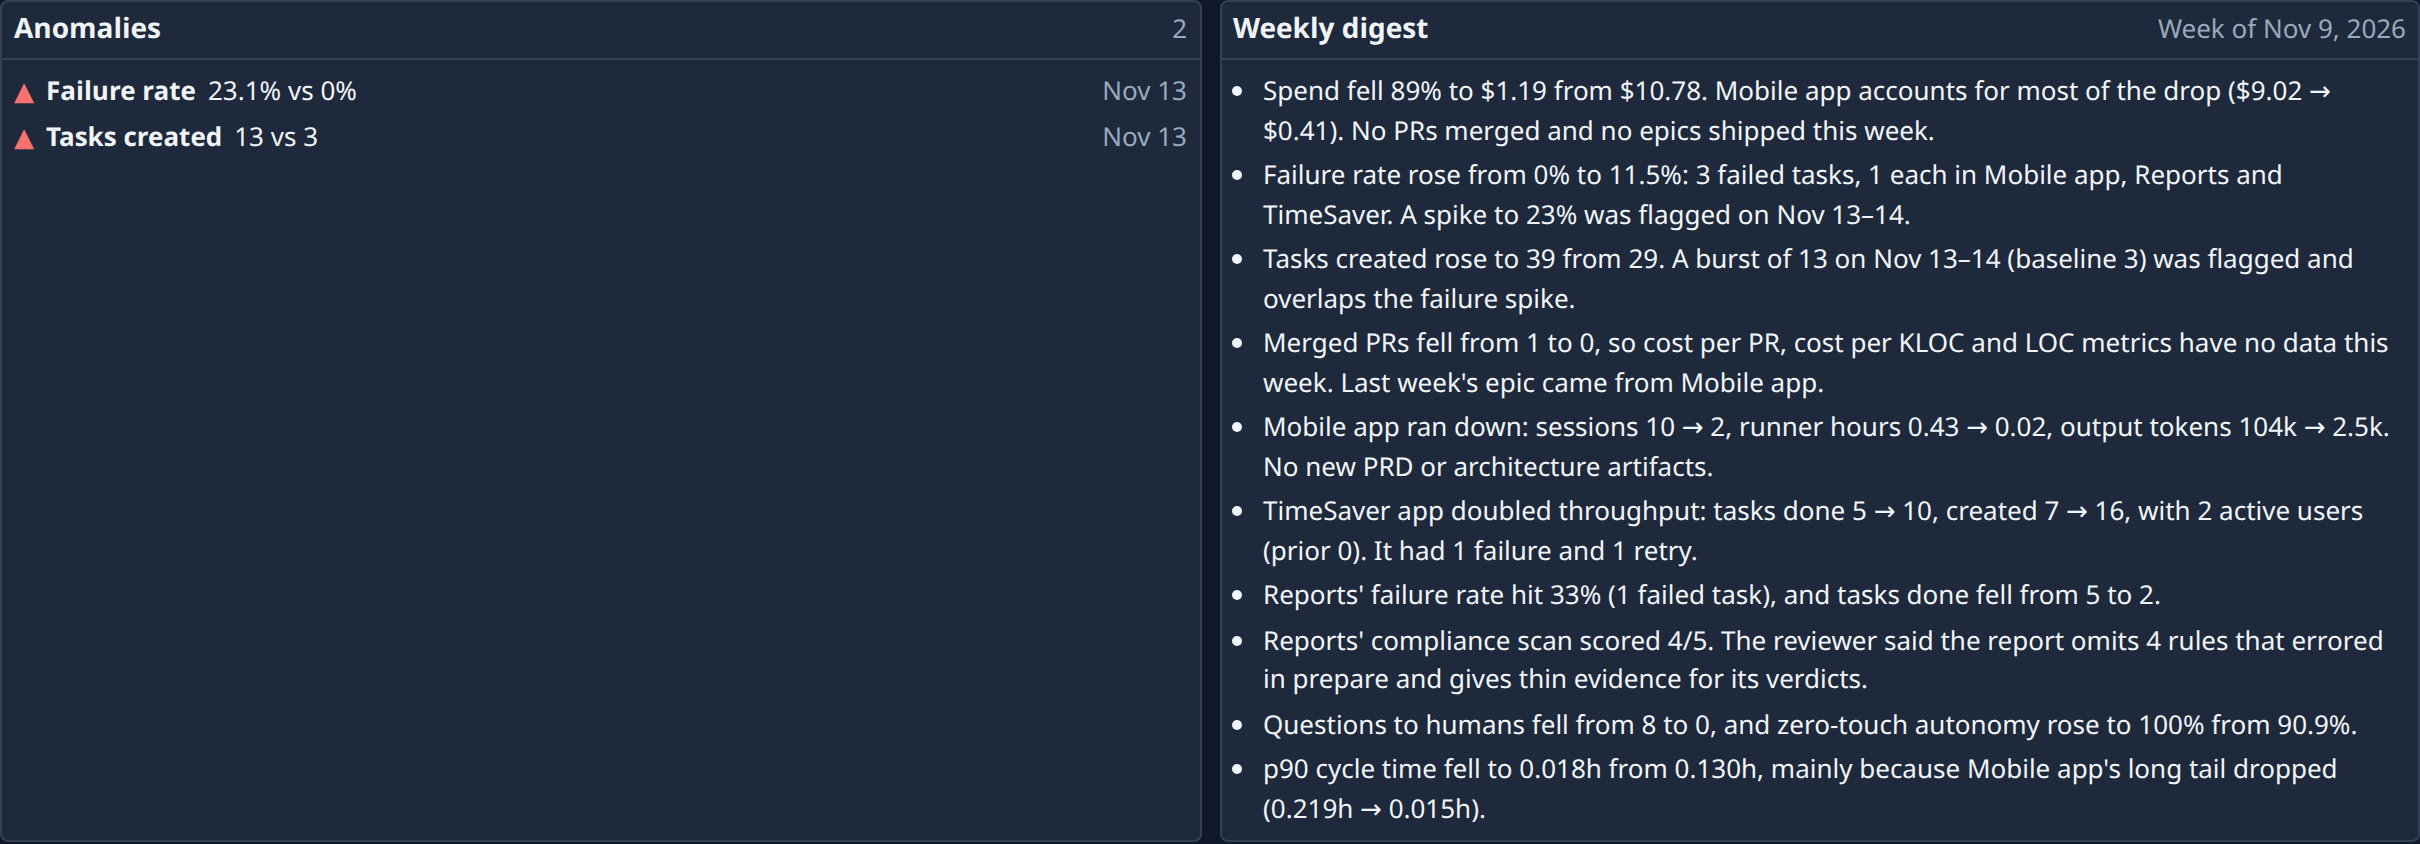
Select the Risks tab and scroll past Bugs & risks to Anomalies and Weekly digest.
-
Read each line under Anomalies. A red ▲ means the figure rose, a blue ▼ that it fell. Then come the figure's name, such as Cost, Tasks created, Failure rate or Quota 7d, its value against its usual level, and the day it happened. Hover the values for the exact figures. The count beside the heading says how many flags there are; No anomalies means every figure stayed in its usual range.
-
Read Weekly digest. Week of names the week it covers, and each bullet is one change the AI found in that week. Nothing changed this week and No digest yet need no action. Digest failed names the error; the next week's digest is written again on its own.
-
Follow up each flag where its figure lives:
- Cost up: open the Cost tab and read the spend trend and the spend by project, agent and model for that day. See See where your AI spend goes.
- Failure rate up: read Bugs & risks above it and open the failed tasks. See Find what needs attention.
- Tasks created up or down: open the Delivery tab and compare Created vs done. See Check what your team delivered.
- Quota 7d up: check your model accounts before they reach their limit. See How model accounts work.
-
Come back next week. Each flag is worked out afresh on every refresh and drops off once its day falls out of the range; nothing has to be dismissed.
Related
- How the command center works — where its figures come from.
- Read the command center — every tab, tile and column on the page.