Record monitoring alerts as incidents
Failed releases, regressions and failed probes become incidents on their own once a project's releases are connected. Errors your users hit in production come from your monitoring tool, and reach Jaah only once you connect it. This guide connects Sentry: each alert it sends is recorded on Incidents under one project, with the pull requests Jaah suspects, and repeats of the same problem raise its count instead of adding rows. The connection is an automation whose source is Sentry; it records incidents and files no task by itself.
Before you start: Production QA is a plan feature. While your organization doesn't have it, Sentry is not offered as a source. You also need to be able to create integrations in your Sentry organization.
Who can do this: automations are for your organization's Owners and Admins.
Connect Sentry
-
In the sidebar, select Audit, then the Automations tab, and select New automation.
-
On When, set Source to Sentry. A note reads Records incidents in the target project. Files no task. In Environments, enter the Sentry environments to record, such as
production, comma-separated; leave it blank to record every environment. Select Next.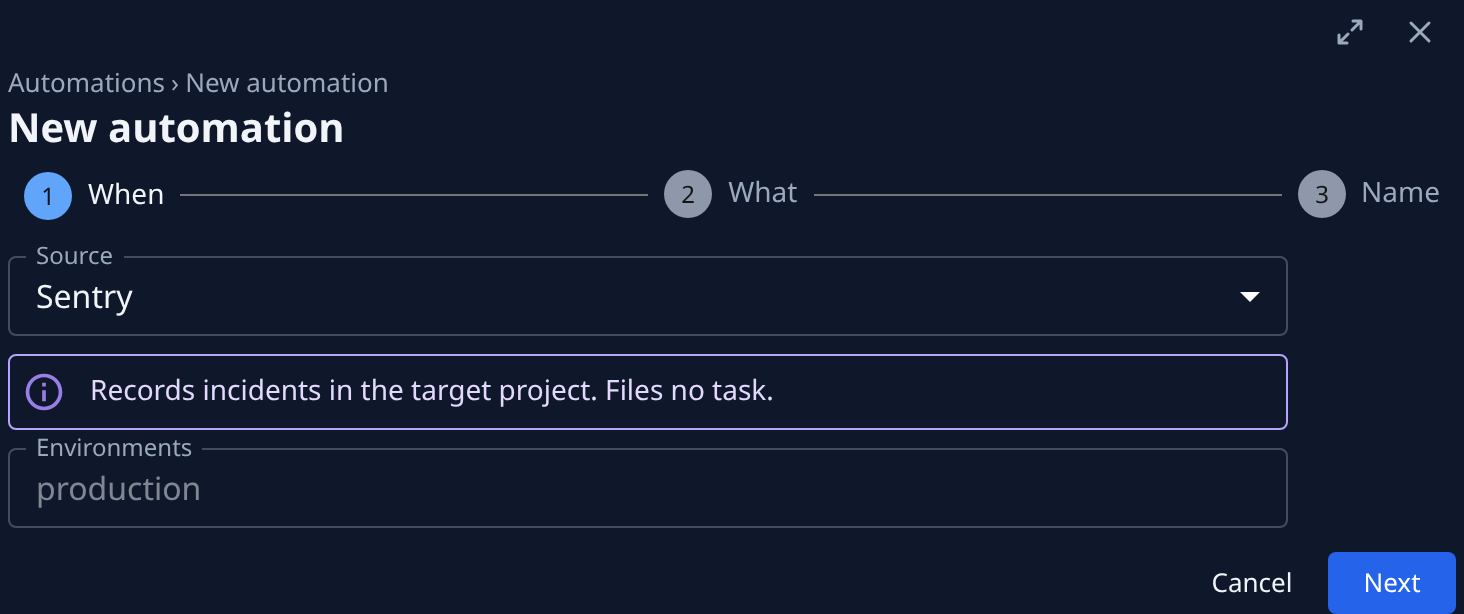
-
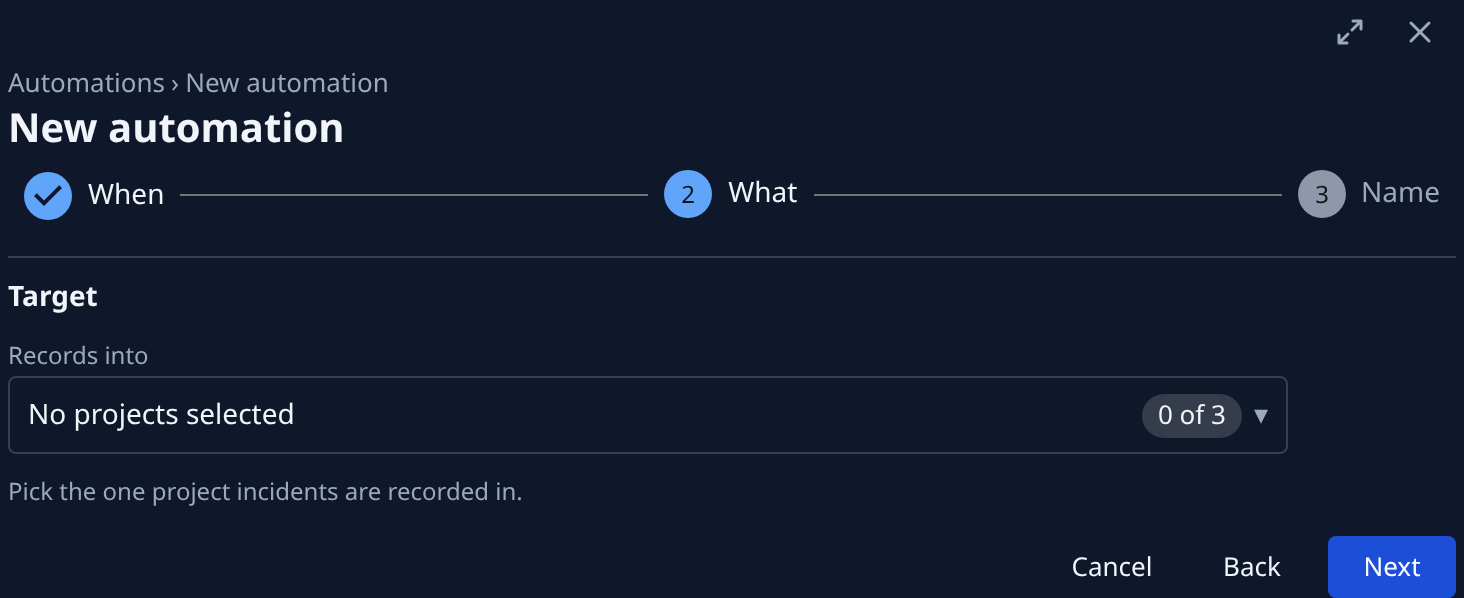
On What, under Target, pick the one project the alerts belong to in Records into. There is no Action to set: this source only records. Select Next.
-
On Name, enter a Name you'll recognize, such as
Sentry — web app, and select Create. -
A Store this secret now dialog opens. Sentry signs its deliveries with its own secret, so you won't use this one: select I’ve stored it.
-
On the automation's Setup tab, under Endpoint, select Copy URL beside Webhook URL.
-
In Sentry, open Settings, then Custom Integrations, and create an integration. Paste the URL as its Webhook URL, turn on Alert Rule Action, and tick the Issue webhook. Save it, then copy its Client Secret.
-
Back on the Setup tab, paste it in Sentry Client Secret and select Save. Jaah now checks every delivery's signature against it, and refuses one that doesn't match.
-
In Sentry, add the integration as an action on the alert rules whose alerts Jaah should record.
Check the first alert
-
Wait for the next alert, or trigger one from a Sentry alert rule.
-
Select Incidents in the sidebar. Set Project to the project you picked and Type to Monitor.
-
The alert shows as an incident, Open, with its severity and when it was last seen. Open it: Source, the Vendor link back to the Sentry issue and, when Sentry sent them, the Release, Commit and Stack are on Overview; the pull requests Jaah suspects are on Suspects.
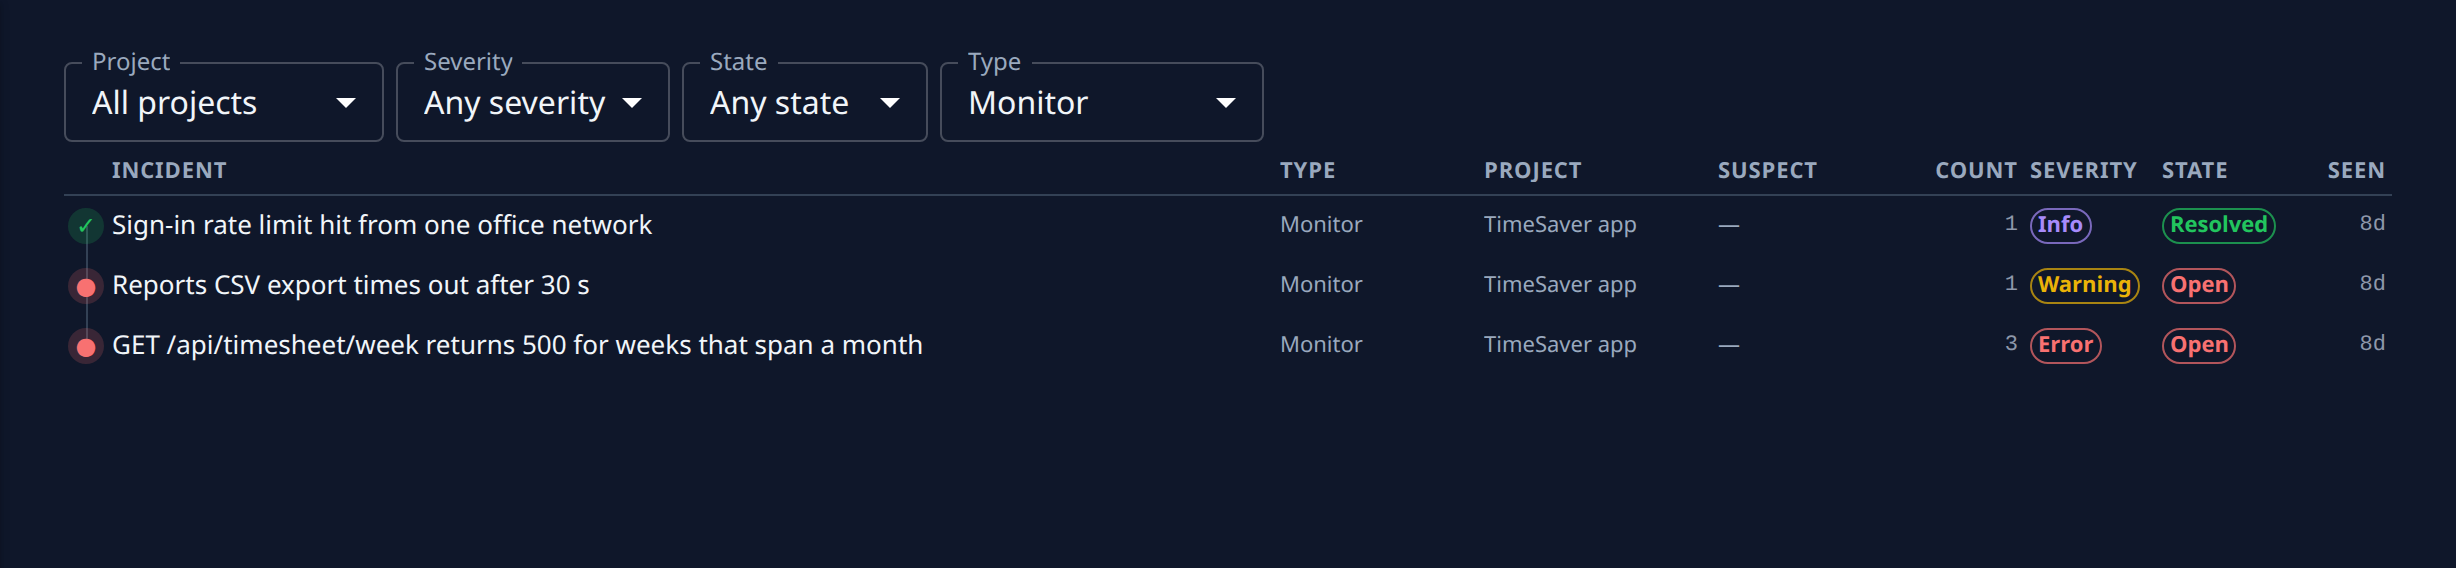
When you resolve the issue in Sentry, the incident turns Resolved; if Sentry sees it again, it turns Reopened.
Nothing there? Check that the alert rule uses the integration, that the alert's environment is listed in Environments (or that it is blank), and that the Sentry Client Secret you pasted is that integration's own: a delivery whose signature doesn't match is refused.
File tasks from these incidents
Recording is only half of it. To have Jaah file a task for each new incident, with its suspects in the brief, turn the project's Production QA switch on and add its default automations: see Turn on Production QA for a project. To find the change behind an incident yourself, see Find the pull request behind an incident.
Datadog, PagerDuty and CloudWatch connect the same way: pick them as the Source, and the Setup tab lists what to enter on their side. See Create an automation.
Related
- How Production QA works — where incidents come from and how suspects are found.
- Incidents — every column, filter and tab on the Incidents pages.