Put together a monthly update
Once a month, someone has to tell leadership what the agents delivered, what it cost and whether the work is getting better. The command center holds every figure you need. This guide walks its tabs over the last 30 days and collects one or two lines from each, with a link that opens the same view. What each tile and tab means is in Read the command center.
Who can do this: requires the org owner or org admin role. Members don't see Reports.
-
In the sidebar, select Reports. In the bar, pick 30d in the range menu. To report on one project, pick it in Project; leave it on All for the whole organization.
-
Read the five tiles under the bar for the headline: Active projects, In flight, Failed or stuck, Spend and Worst health.
-
Select the Delivery tab. Note PRs merged, Epics merged and Cycle median. Under Tasks by state, each count opens the Tasks board on that state, if you need examples.

-
Select the Cost tab. Note Spend and which project, agent or model took most of it in Spend by project, Spend by agent and Spend by model.
-
Select the Quality tab. Note Success rate, Zero-touch and Review score, each with its line ending vs before, which compares the month with the 30 days before it.
-
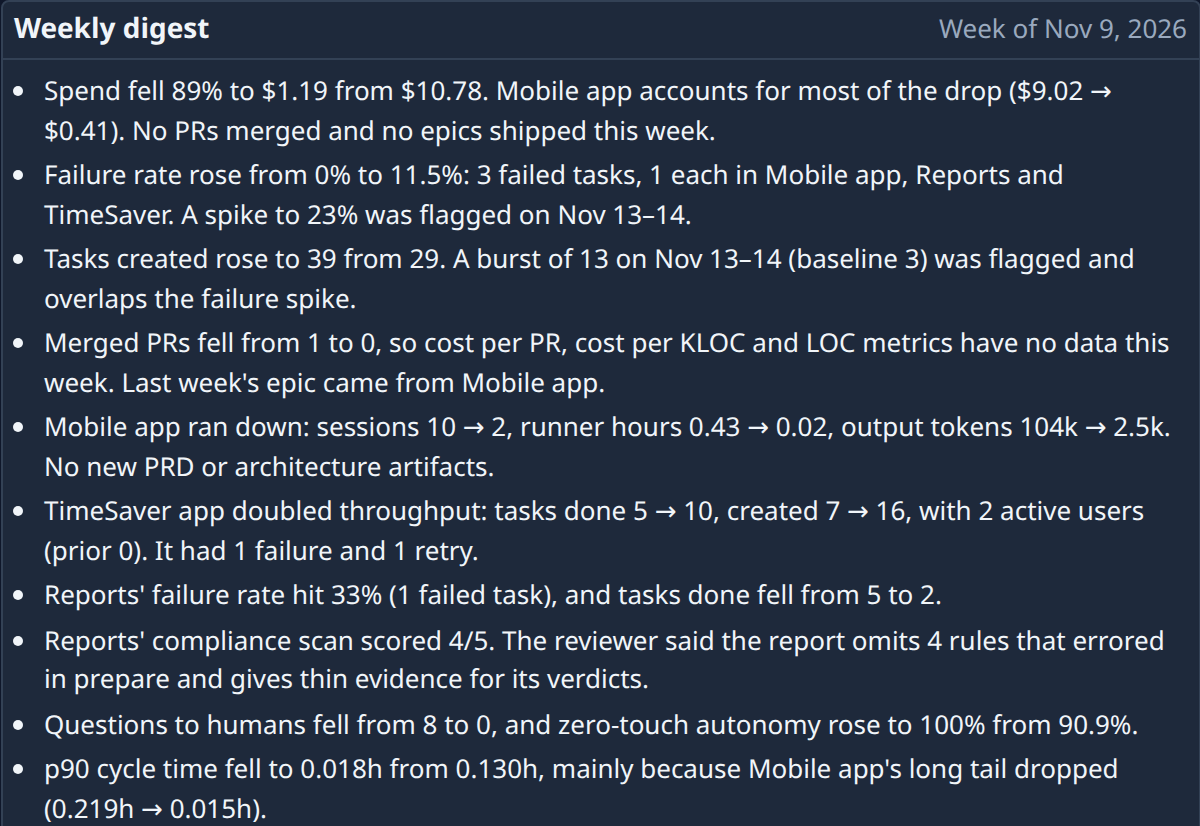
Select the Risks tab. Read Weekly digest for the AI's summary of the latest week, and Anomalies for any figure that left its usual level. Pick the one or two worth raising.
-
On each tab you quote, copy the page's address and paste it beside the figure in your update. Another Owner or Admin who opens it sees the same tab, range and project, with the figures as of the moment they open it.
The figures are live, not a snapshot: as of in the bar says when they were taken. Write the numbers into your update rather than relying on the link to show the same values next month.
Related
- Share a command center view: what a copied link keeps and what it doesn't.
- Check whether quality is improving: every Quality tile and how sure each one is.
- See where your AI spend goes: the Cost tab in depth.