See what an epic cost
An epic is run by several runners, one per subtask, so its cost is spread over many tasks. The epic's own figures add them all up. Do this to see what a piece of work cost in total, and which stage took the most.
Who can do this: anyone who can view the epic.
-
On the task board, find the epic. The Cost column on its row counts the epic and all its subtasks, in whole dollars rounded up. Hover the figure for the exact amount. A * after it means part of it is a cost an agent reported itself.
-
Select the epic's title. Its page opens beside the board.
-
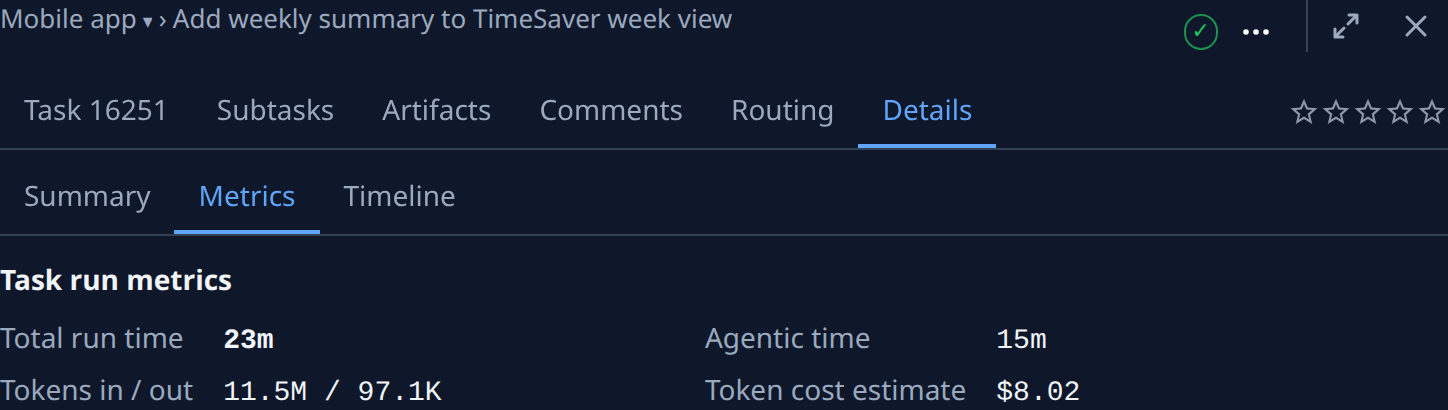
Select the Details tab, then Metrics. Task run metrics covers the whole epic, every subtask included: Total run time, Agentic time, Tokens in / out and Token cost estimate. While subtasks still run, the figures grow as you watch.
-
Select the Subtasks tab. It lists every subtask by stage: Prepare, the build phases and Finish.
-
Select a subtask's title, then Details › Metrics. Its Token cost estimate is that subtask's share, and Model names the model level it ran at.
-
Repeat for the other subtasks. Build subtasks usually cost the most, since each one writes and tests a change.
If the Cost column is missing on the board, it is hidden: turn it back on under Filter & view › Columns, or widen the window, since narrow screens hide it.
To keep a large epic's cost down, cap how many subtasks run at once, or check each stage before the next one starts.
Related
- Check what a finished epic delivered: the time and tokens each stage used, in Finisher notes.
- Limit how many subtasks run at once: set Throttle so fewer runners work together.
- Read a task's result: the same Metrics tab on a single task.
- Choose which columns the board shows: show or hide Cost and Tokens.