Read a node's status
When tasks don't start, or start slowly, the node they run on is the first thing to check. Its row gives you a quick answer; its details tell you why.
Who can do this: anyone who can view nodes.
Read the list

- In the sidebar, select Directory, then the Nodes tab.
- Find the node's row. A green dot before its name means it's online.
- Check Enabled: ✓ means the node takes new tasks.
- Read the three load bars: C for CPU, M for memory and D for disk. A bar turns yellow, then red, as it fills.
- Read the counts: worktrees / runners / accounts on the node. Hover them for the words.
- Check Last seen. A node reporting normally shows now or a few seconds.
Find out what's wrong
-
Select the node's name. Its details open beside the list on the Overview tab.
-
Check Status, Last Seen and Accounts. Accounts counts the AI accounts with a working sign-in on this node; a node with none can't run tasks.
-
Select the Health & Metrics tab.
-
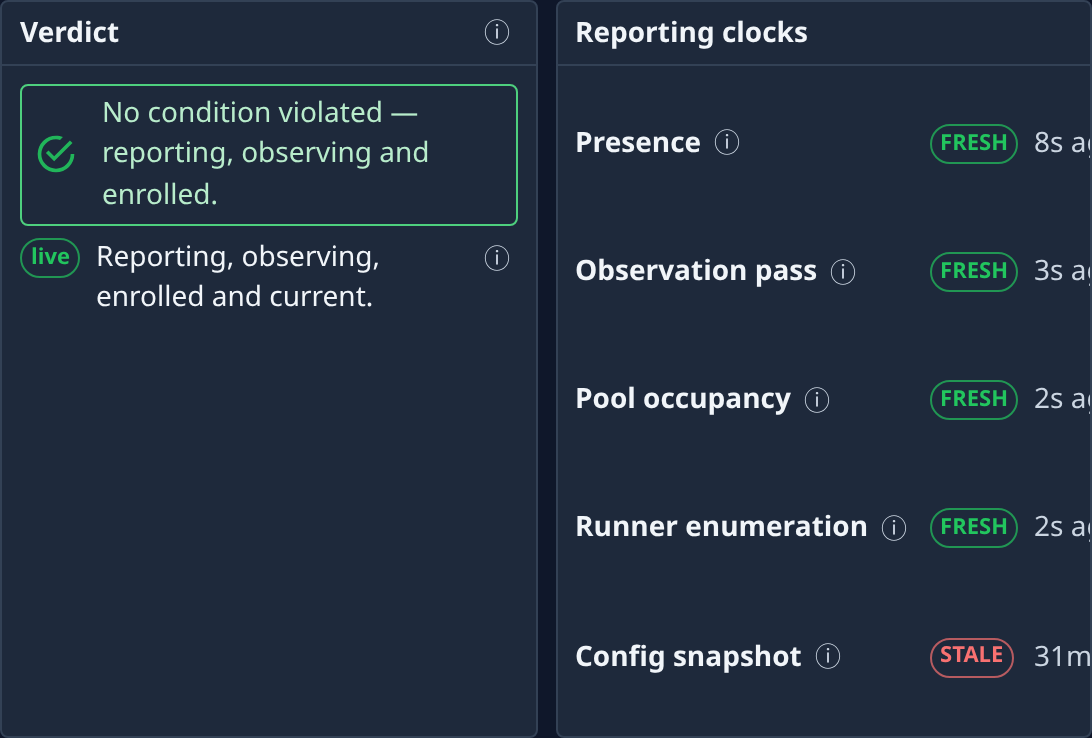
Read the Verdict. On a healthy node it says no condition is violated.
-
Read the Reporting clocks. A clock marked STALE names the kind of report the node has stopped sending. Hover ⓘ for what each report is.
-
Under Metrics, pick 1h, 6h, 24h or 7d to see how CPU, memory and disk have moved over time. Dashed lines mark 75% and 90%.
What to do next
- A node that is online but full: drain it or add another node.
- A node with no worktrees for your project: add worktree slots.
- A slot that looks stuck: read a worktree's status.
- Every field and clock: Nodes.
- What each status and state means: How nodes work.