Record Datadog alerts as incidents
When a Datadog monitor alerts, Jaah can record it on Incidents under one project, with the pull requests it suspects. Repeats of the same alert raise its count instead of adding rows, and when the monitor recovers the incident turns Resolved. The connection is an automation whose source is Datadog. It only records incidents and files no task by itself.
Datadog does not sign what it sends. Instead, each alert carries a secret that Jaah gives you, in a header you add to the Datadog webhook, so keep that secret when Jaah shows it.
Before you start: Production QA is a plan feature. While your organization doesn't have it, Datadog is not offered as a source. You also need to be able to add webhooks and edit monitors in Datadog.
Who can do this: automations are for your organization's Owners and Admins.
Connect Datadog
-
In the sidebar, select Audit, then the Automations tab, and select New automation.
-
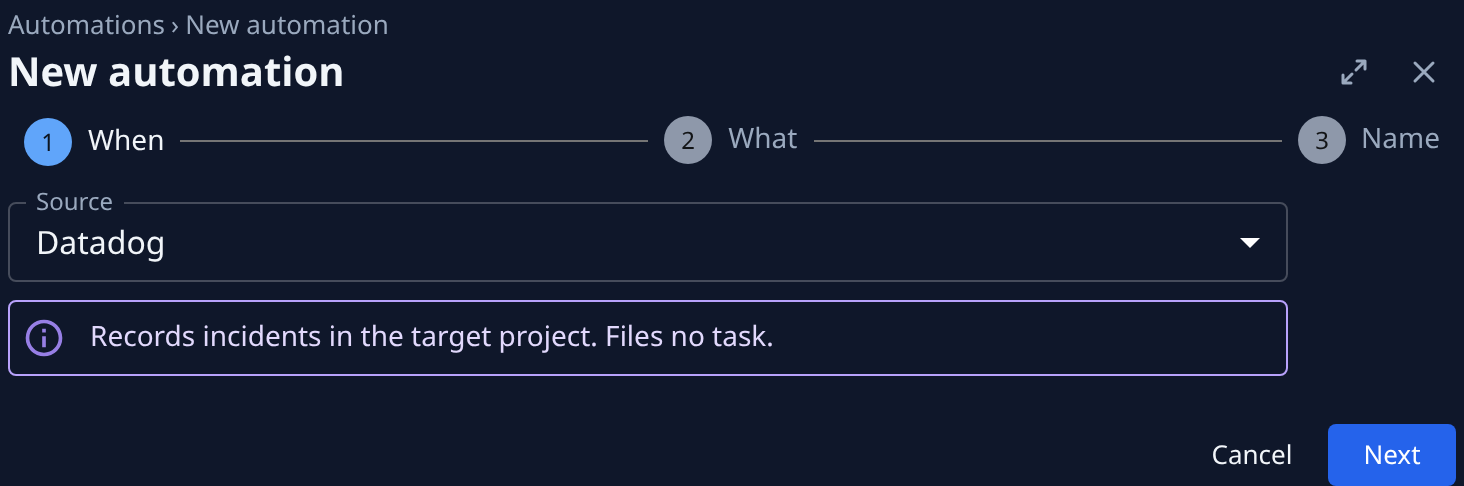
On When, set Source to Datadog. A note reads Records incidents in the target project. Files no task. Select Next.
-
On What, under Target, pick the one project the alerts belong to in Records into. Select Next.
-
On Name, enter a Name you'll recognize, such as
Datadog: web app, and select Create. -
A Store this secret now dialog opens. Copy the secret and keep it somewhere safe for step 8: it is the only time Jaah shows it. Then select I’ve stored it.
-
On the automation's Setup tab, under Endpoint, select Copy URL beside URL.
-
In Datadog, open the Webhooks integration and add a new webhook. Give it a name and paste the URL.
-
Back in Jaah, select Copy payload under Payload and paste it as the payload of the Datadog webhook. Then select Copy beside Custom headers, paste it as the custom headers of that webhook, and replace
<secret>with the secret from step 5. Hover Custom headers in Jaah: it suggests keeping the secret in a hidden Datadog custom variable rather than typing it into the header. Save the webhook in Datadog. -
In Datadog, mention the webhook in the notification message of each monitor whose alerts Jaah should record.
Check the first alert
- Wait for a monitor to alert, or trigger one in Datadog.
- Select Incidents in the sidebar. Set Project to the project you picked and Type to Monitor.
- The alert shows as an incident, Open, with its title, its severity and when it was last seen. Open it to see the Vendor link back to the Datadog monitor and, on Suspects, the pull requests Jaah suspects.
The severity comes from the monitor's priority: P1 is recorded as Critical, P2 as Error, and anything else
as Warning. When the monitor recovers, the incident turns Resolved. Jaah reads the env and version tags
on the alert as its environment and release, so tag your monitors with them to get those filled in.
Nothing there? Check that the monitor's notification mentions the webhook, that the payload is exactly the one Jaah gave you, and that the header carries the secret from step 5: an alert without the right secret is refused. If you lost the secret, select Rotate secret under Endpoint. The old one stops working at once, so put the new one in the Datadog header straight away.
Related
- Record monitoring alerts as incidents: the same connection for Sentry.
- Triage open incidents: work through what arrives.
- Turn on Production QA for a project: have Jaah file a task for each new incident.
- Automations: every field on the automation's page.