Check how much memory and CPU a task used
A task that ran slowly, or a node that filled up while it ran, raises the same question: how much did the task take? Its Metrics tab answers it: how long it ran, the tokens and cost it used, and the memory and CPU its sessions took on the node.
Who can do this: anyone who can see the task.
-
Open the task: select its title on the board.
-
Select the Details tab, then Metrics. A task that never ran has no Metrics.
-
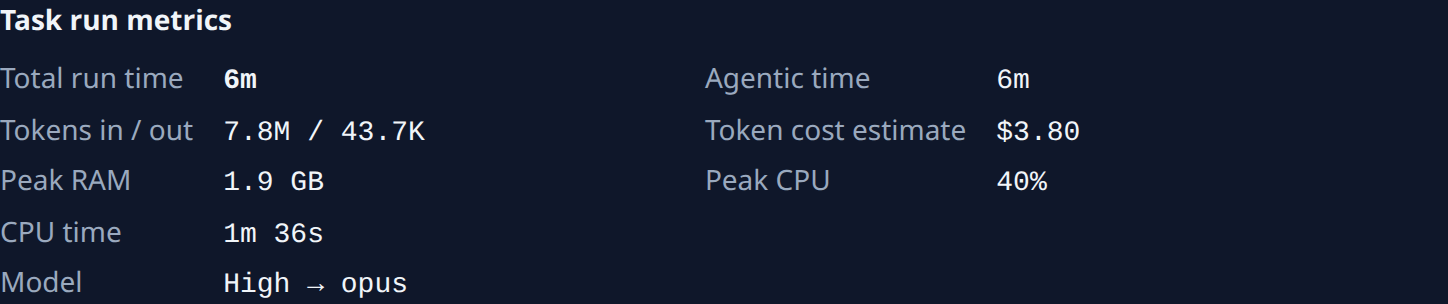
Read Task run metrics:
- Total run time: from Go to done, every wait included;
- Agentic time: the time the task spent running, without queues, waits for you and pauses;
- Tokens in / out and Token cost estimate, at list rates when it ran. Hover the tokens for the exact counts;
- Model: the model level picked and the model that ran, such as High → opus.
-
Read the resource figures: Peak RAM, the most memory a session used at once; Peak CPU, the most CPU at once, where 100% is one full core and 200% two; and CPU time, the processor time the sessions used in all.
-
Look under the figures for the RAM and CPU charts, once the sessions' readings load. They draw one line per session over the run, named by the node it ran on, so you can see which session peaked and when.
-
If the task is still running, the panel says Still running — running totals. Come back once it is done for the final figures.
A figure that reads not reported or not captured was not measured for this run, often because it ran before the node measured sessions. The resource rows and the charts show only once a session reported readings.
To see whether the node itself is big enough for tasks like this one, compare the peaks with its size: see Check whether a node is big enough.
Related
- Read a task's result: the outcome, the change and the cost of a finished task.
- See what an epic cost: the same tab for a whole epic and its subtasks.
- Find what is overloading a node: when many tasks share one node.